
This blog post is on the launch of the ANSR (Arizona Near Space Research) near space balloon #55
Rich Osgood from Heatsynclabs.org and I were invited observers. Our objective was to help track the balloon and locate the landing zone while testing our own radio balloon tracking equipment. I’m working with Heatsynclabs.org in planning a near space balloon flight later this summer and this was great exposure with a group that has now launched 55 near space balloons. We learned tons about filling the balloon, rigging, radio transmitting, tracking and recovery. Below is some of those details and if you’re interested I pasted the radio details at the very end.
Their flight reached ~92,000 feet before the balloon popped and the payloads parachuted back to Earth. Many schools in the area participated in the launch with a small payload box of their own containing automated cameras and digital data recorders.
Click {more} to see all the photos and radio details.
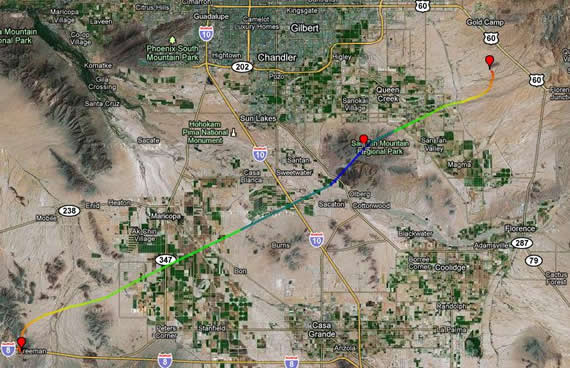
Here is the original flight *prediction* plot: This is just a predication of the flight done a day earlier using all available weather and payload data and some advanced prediction software written just for ballooning. The color of the plot line indicates the predicted altitude. The red marker on I-8 is the launch site, the red marker on the blue part of the flight line indicates the max altitude where the balloon will pop because of the lack of atmospheric pressure. The final red marker near Hwy-60 is the software predicted landing zone in the desert.
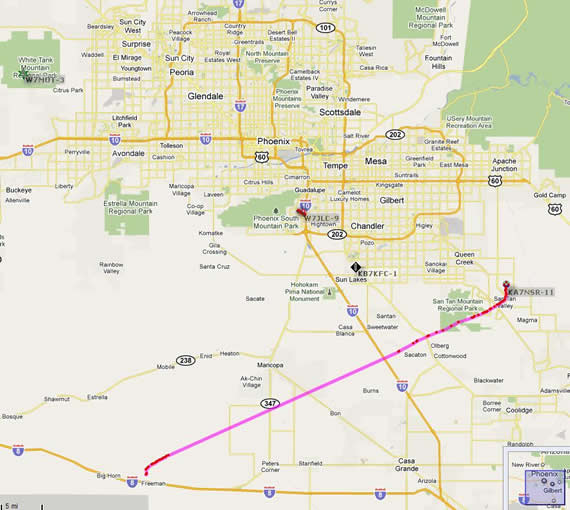
This is the actual flight: The balloon transmitted APRS tracking data which is picked up and repeated eventual reaching the internet where it is plotted in almost real-time at http://aprs.fi (Here is a link to this flight’s APRS data plots on callsign KA7NSR-11)
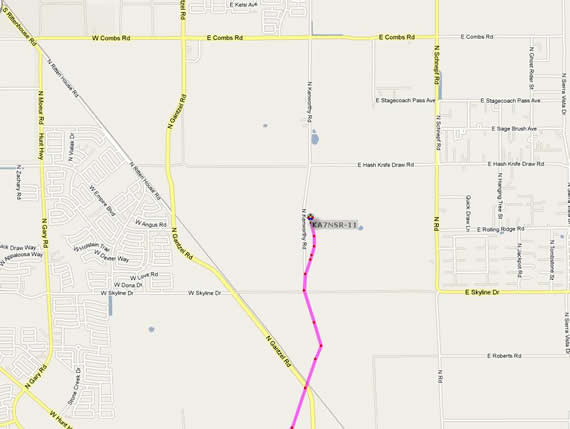
Zoom in on launch plots:
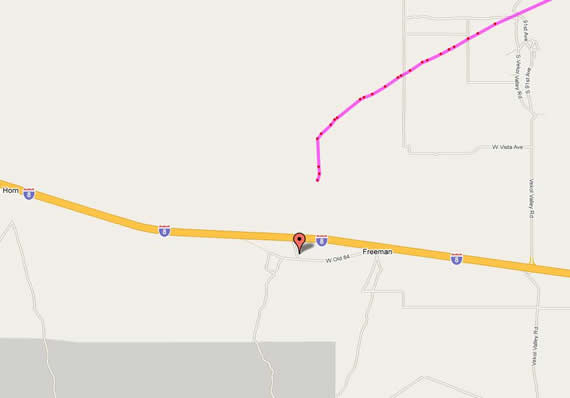
Final flight details and a zoom in on landing zone plots:
ANSR-55 Flight Date: 10 April 2010
Launch: 15:10:02, 1798 feet, 32 deg 50.72 min N, 112 19.07 min W
Landing 16:52:28, 1703 feet, 33 deg 11.96 min N, 111 32.78 min W
Maximum Altitude: 92,935 feet, 33 deg 4.97 min N, 111 deg 46.84 min W
Flight Duration: 102 min 26 sec
Distance Flown: 51.01 miles, bearing 61 deg vs Pre-flight
Prediction of 58.4 miles, 64.3 deg
Average Ascent Rate: 1291 ft/min
Descent Rate at Landing: 1380 ft/min, 15.7 MPH
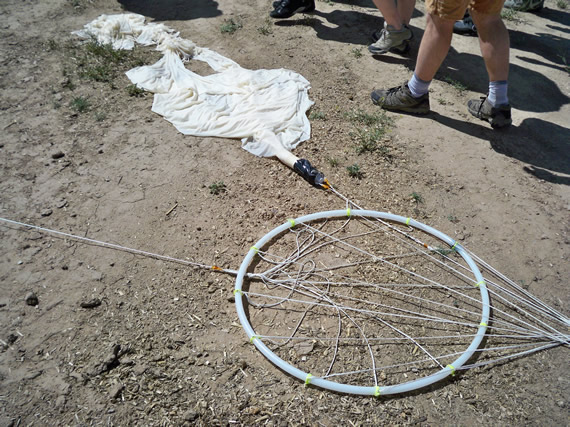
This is the parachute that hangs between the balloon and the payload boxes during flight.
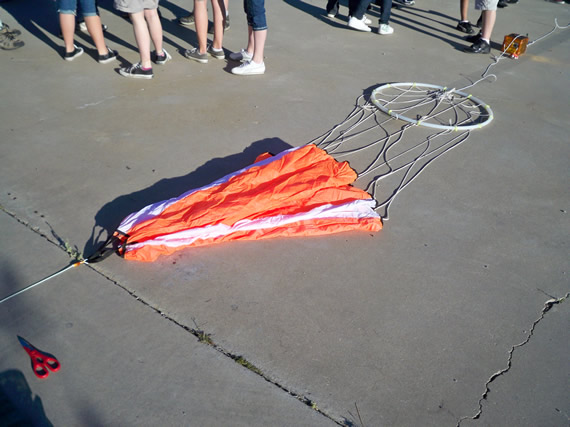
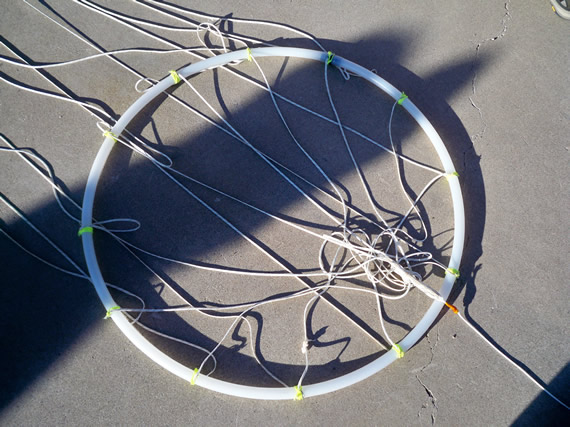
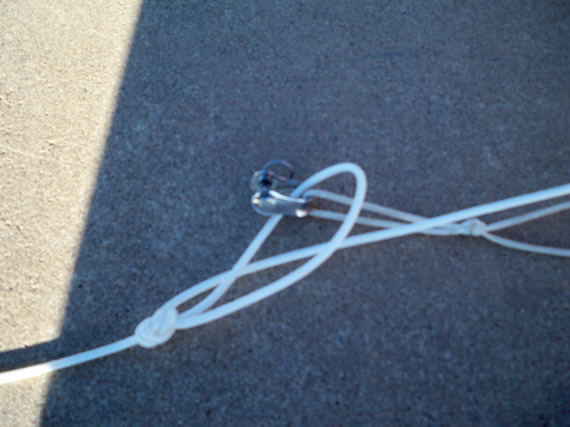
This hoop helps guarantee the parachute lines don’t get tangled during the flight and will open when the balloon pops.
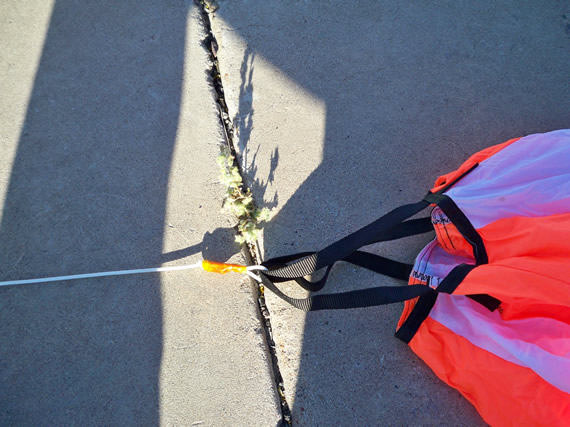
This is the top of the parachute showing how the straps are rigged to the line going to the balloon. The line going to the balloon is made longer than the parachute and parachute lines going to the first payload box. This helps insure that the shredded balloon and fill nozzle don’t interfere with the parachute during descent. Also the top of the parachute has a calculated hole to allow for some air to escape up through the parachute letting the parachute descend straight without tipping side to side to dump air.
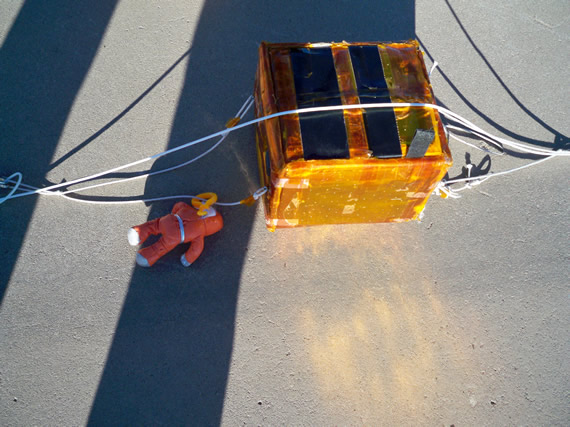
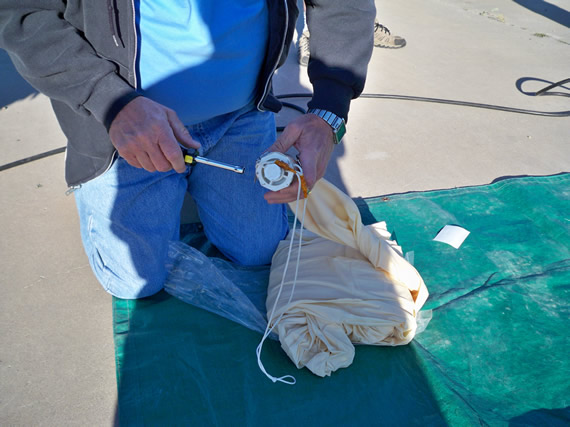
This is the first payload box which holds the primary tracking transmitter. The little puppet is some kind of good luck astronaut I’m guessing.
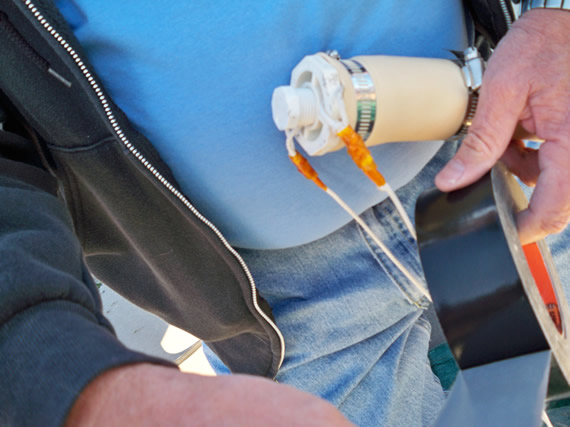
Here they have clipped on the transmitter antenna which hangs below the primary transmitter box.
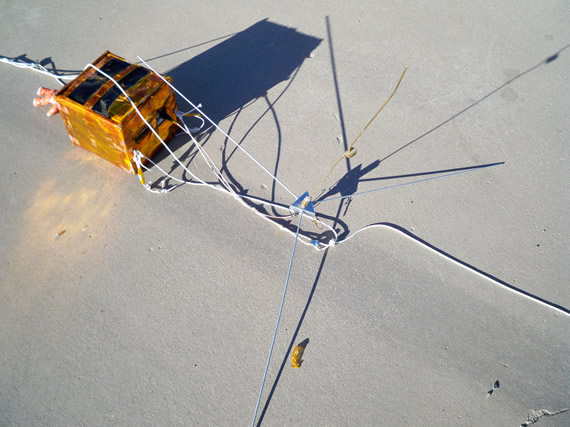
Close up of this antenna.
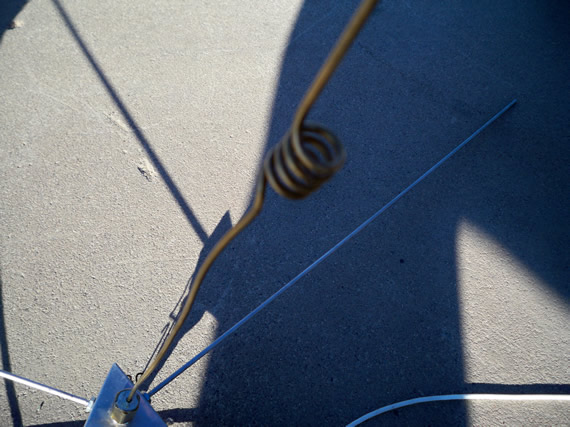
Some kind of extra helix antenna protrudes from under the radial antenna hub.
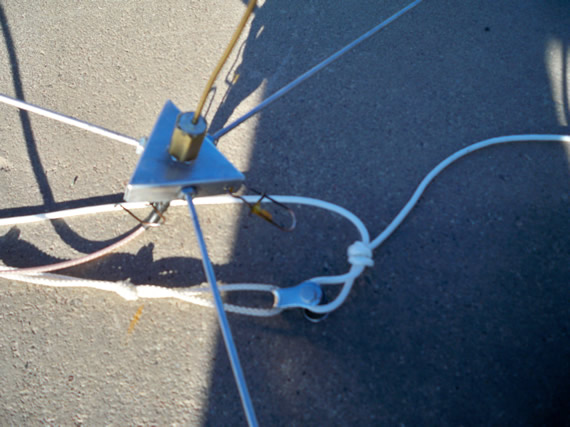
Rigging between transmitter box and other payloads.
They used these metal quick release connectors to chain the 12 payloads together on the ground. I guess they are light and fast to connect and disconnect.
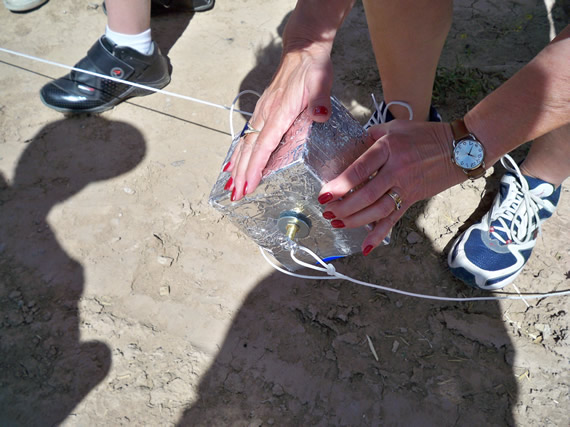
The balloon’s neck is slid over a custom milled section of PVC pipe that has a threaded fill hole and payload strings.
The balloon’s neck is then secured to the PVC using hose clamps. There is an extra deep groove milled into the PVC for the first hose clamp to tighten down into near the fill nozzle. All of this is then wrapped with gorilla duct tape for added strength and to covers the hose clamps.
This is a tarp the balloon is unfolded on to protect the delicate latex. In the center is a clever anchor weight with a carabiner clip.
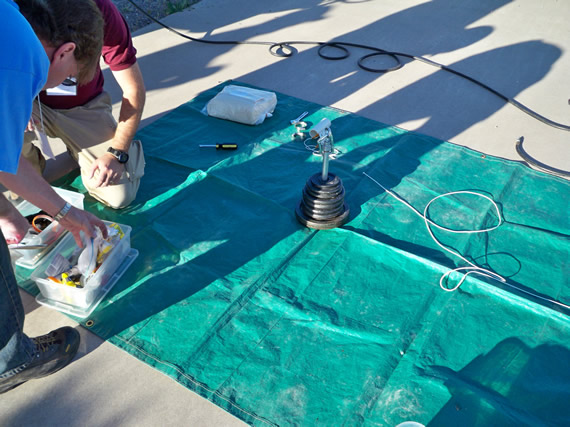
The weights can be adjusted to match the payload weight plus a bit more. The bit more is calculated so the balloon can lift the payload at a predetermined climb rate. The climb rate is important for many reasons one being how high the balloon can reach carrying it’s payload and how quickly it reaches that height. These determine how far you will have to chase the balloon. I have read that this counter weight should be about 1 pound more than your payload for a ~1000ft per minute climb rate but that wasn’t a scientific source by any means.
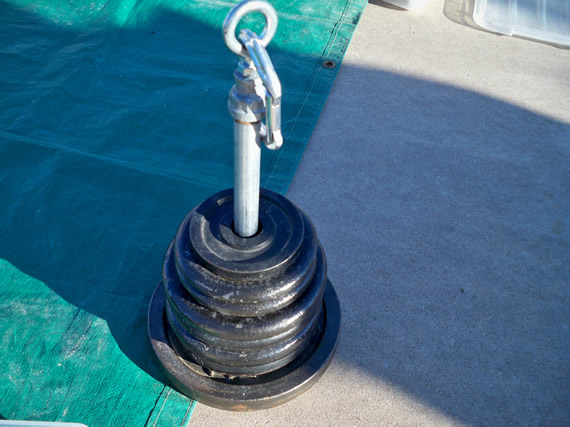
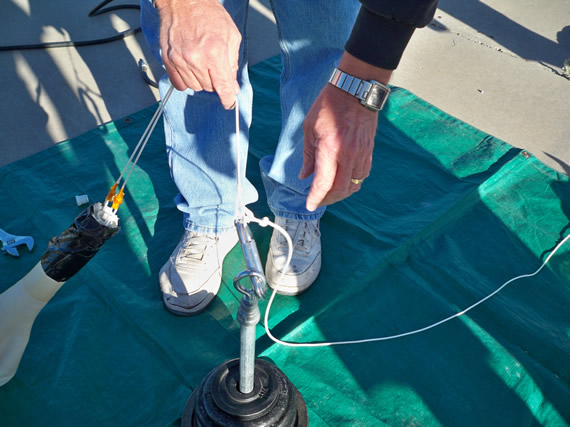
When the balloon is being filled it is connected to this weight using this carabiner clip. This helps keep the balloon down and in one place for the duration of the fill process and doubles as your fill indicator. When the balloon is full enough, it lifts the calculated weight off the ground.
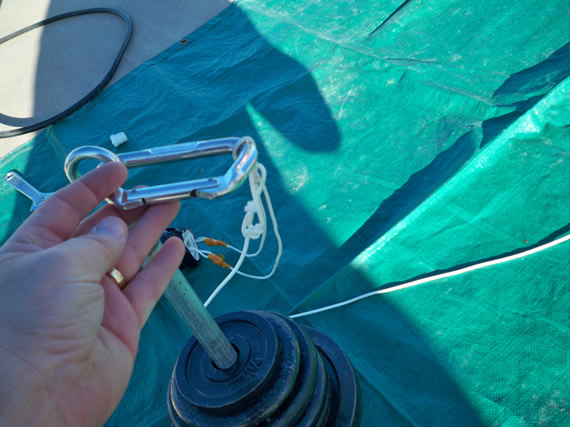
This weight is of course disconnected from the balloon just before launch.
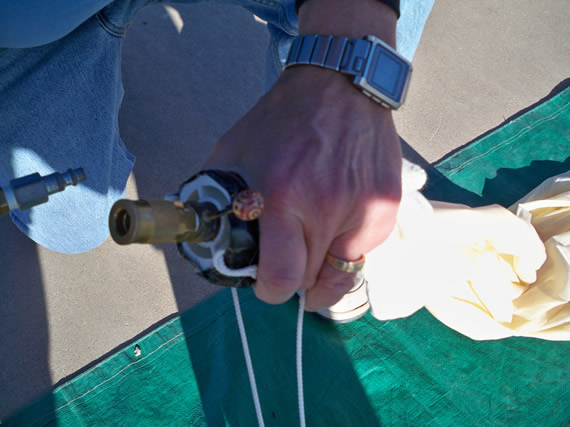
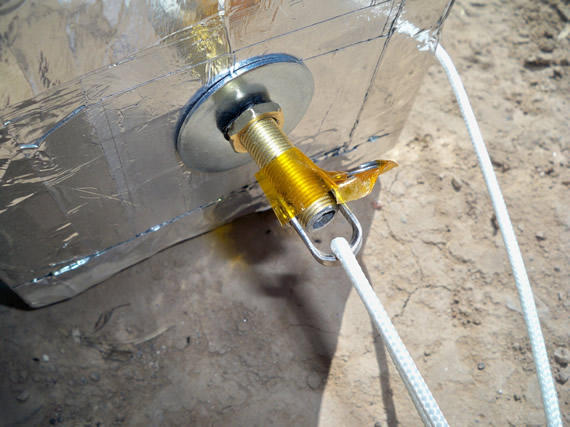
During filling the small threaded PVC plug is removed and a standard air line coupler is threaded into the larger section of PVC pipe clamped to the balloon’s neck.
The helium tanks are then connected to the balloon using standard quick disconnects and air hose. When the balloon is full this quick disconnect coupler is unscrewed and replaced with a thread PVC plug. Unlike a party balloon the helium does not come out when you switch the coupler with the plug because this large balloon is not providing much contraction pressure.
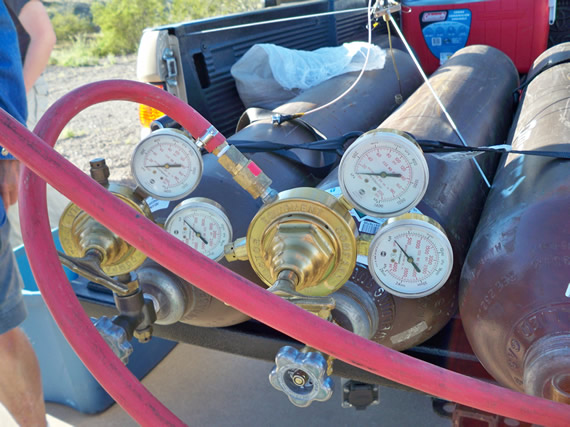
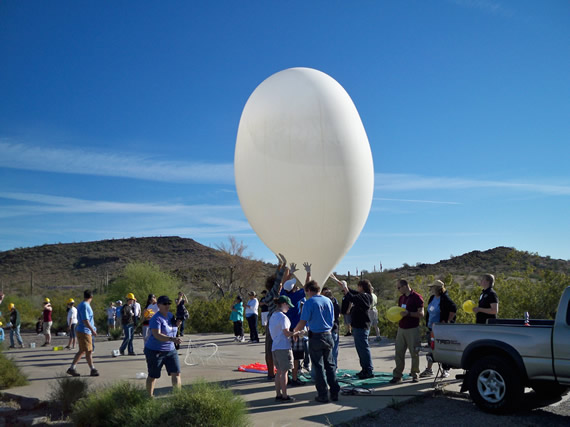
They are using the largest latex weather balloon you can get. The balloon can lift 35lbs+ and took three 219cf tanks of helium to fill. To save time and minimize the time the balloon is on the ground they filled the balloon using two tanks at once.
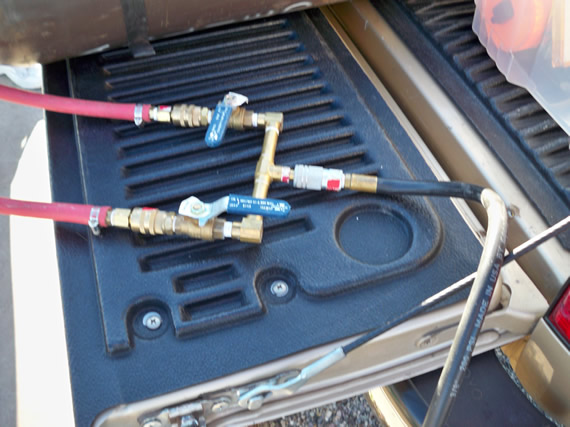
This the the crossover tubing so they could fill using two tanks at a time.
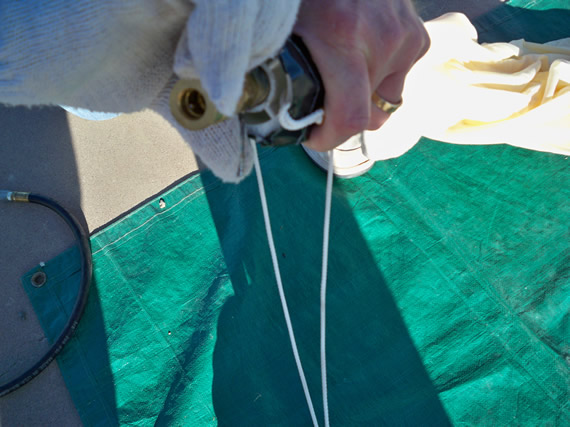
One member of ANSR holds the balloon’s neck and connects the air line while another mans the tanks and controls flow at the regulators and valves.
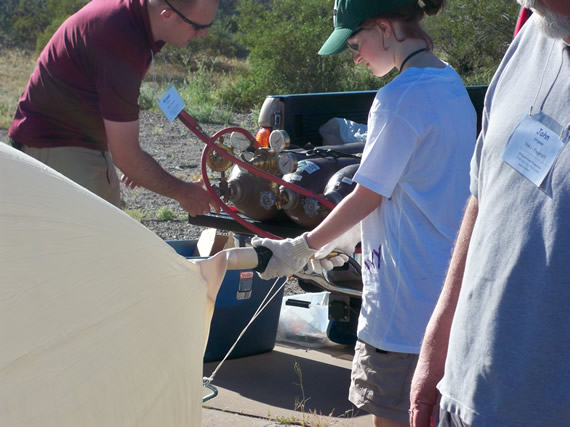
Some students are given special gloves and use their hands to guarantee the balloon doesn’t blow over and hit the ground and pop during filling. The gloves protect the delicate latex from skin oils which could cause the balloon to pop early at a lower altitude.
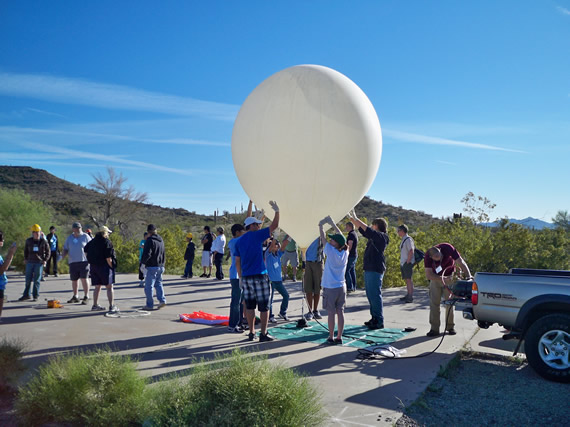
Other students stand near their payload boxes ready to lift them up in a nice straight line so the balloon doesn’t drag any payloads during liftoff.
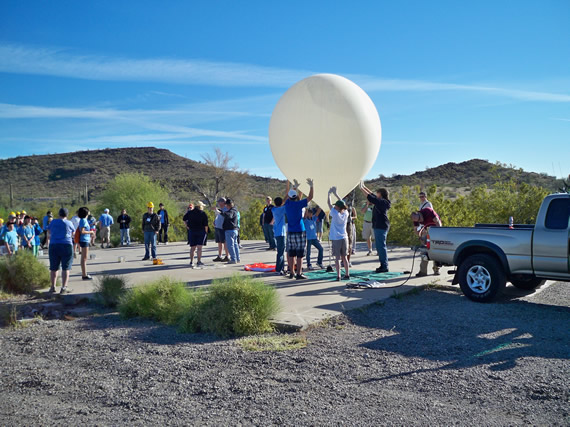
Small yellow party balloons (in their hands near back of truck) were released to test the winds so the 12 payloads could be strung out in a down wind line.
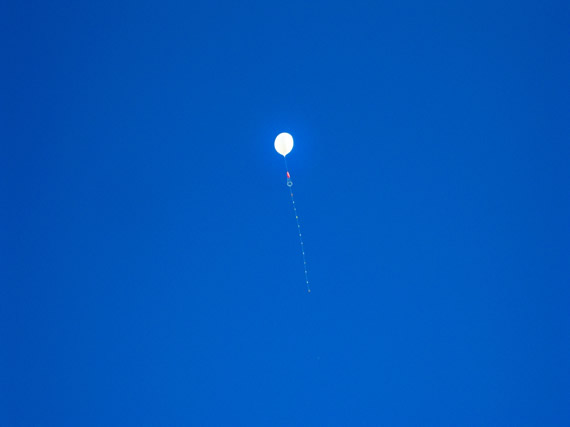
Seconds after launch you can see the 12 payload boxes under the balloon (white beads). You can see the orange parachute and it’s deploy ring between the balloon and the payloads. We tracked the balloon via radio back toward Phoenix but when the data was indicating it was at burst altitude we pulled over to watch. You would not have noticed it unless you had the radio data telling you exactly where to look in the sky. It was a very clear day and we could easily see the balloon at 90,000+ feet being it had expanded to something like 50 feet across at that altitude. And we actually watched it burst which was so cool because it just disappeared in an instant. The parachute is way too small to see at that altitude. We jumped back in the Jeep and were able to continue tracking the payload as the transmitter continued sending GPS data until it landed.
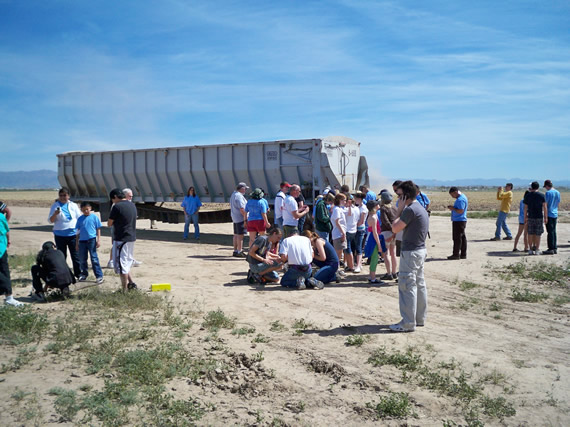
Landing zone.
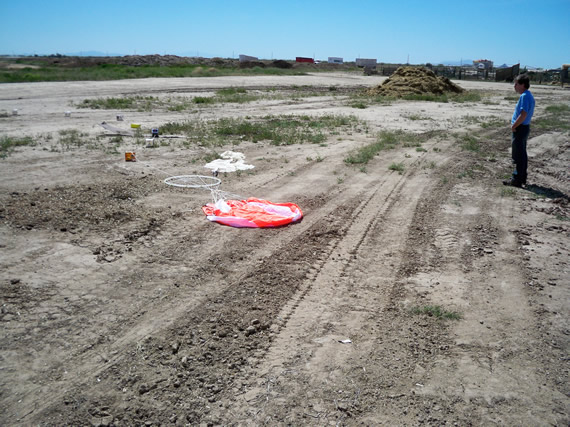
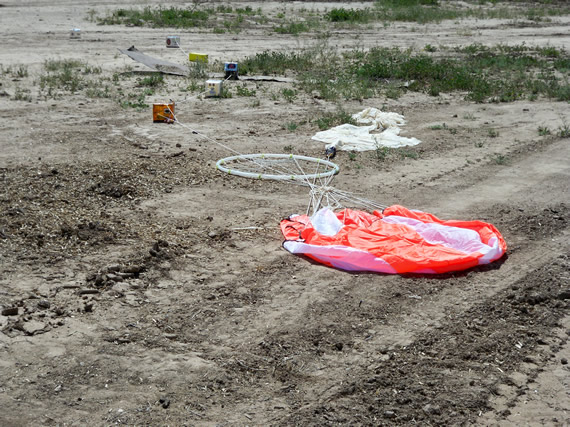
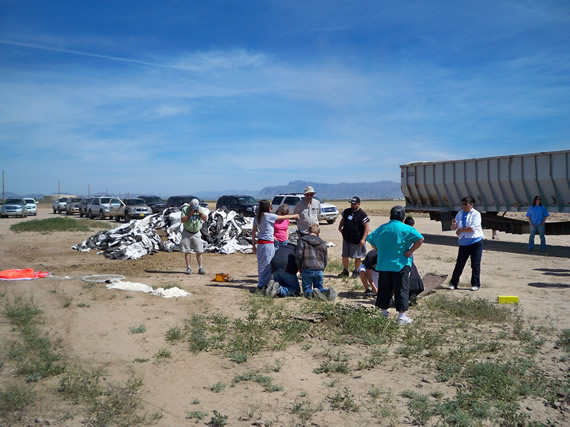
Bits of shredded balloon, parachute and payload boxes strung across the dirt area.
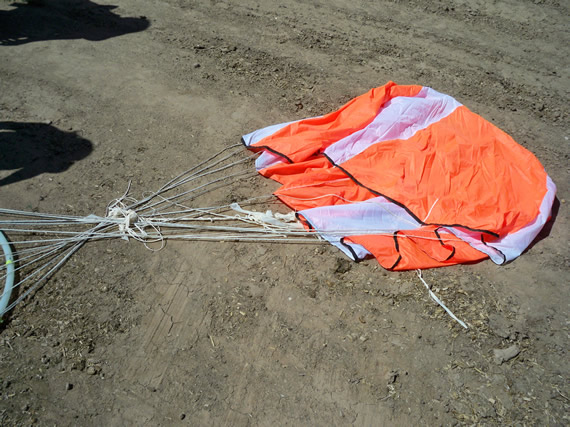
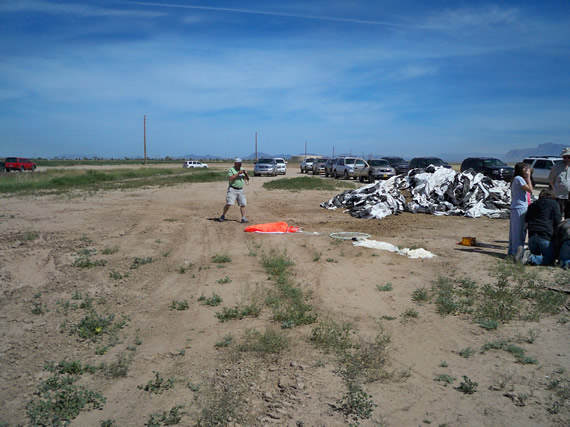
Parachute
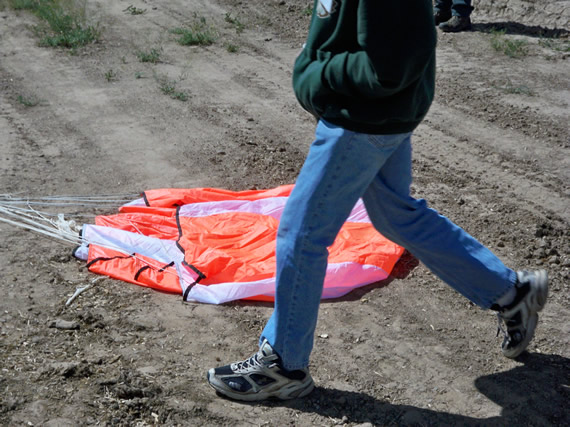
Parachute
Bits of balloon and the parachute ring.
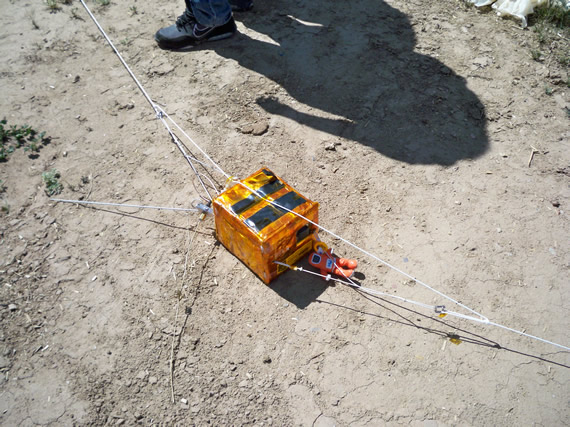
Primary transmitter box.
Student box with camera. The student is testing the camera.
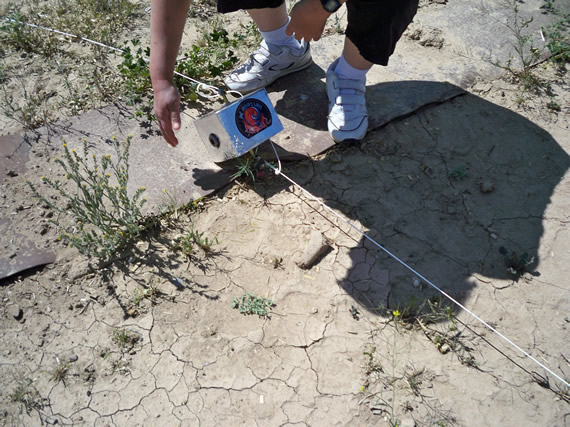
Same student box with camera.
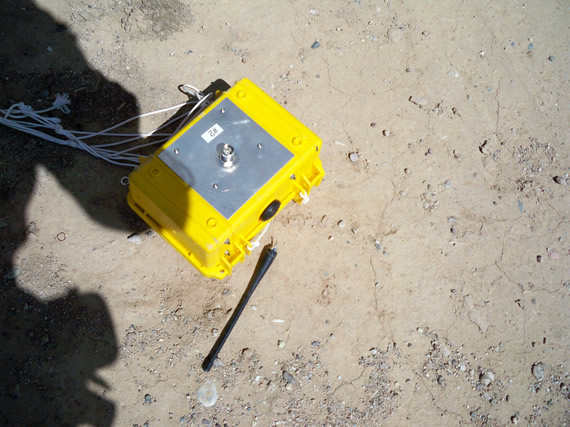
This yellow box is the backup APRS data beacon with callsign N7ERU-12. It belongs to the ERU group (Embry-Riddle Aeronautical University). Here is a link to its backup APRS data plots on callsign N7ERU-12
Another student box with camera.
Another student box with camera.
Another student box with camera.
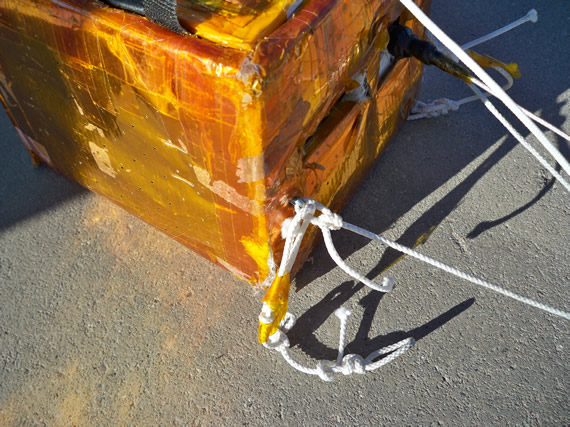
Looking at rigger and ties between payloads.
In this photo you can kind of see a hollow threaded rod that goes through the payload box from top to bottom. Each payload had this design so they would have a hard link between each payload box. There is also an added safety cord between the top and bottom of each payload. These two tricks are done so that if a students box fails and comes apart, the remaining payloads are not lost.
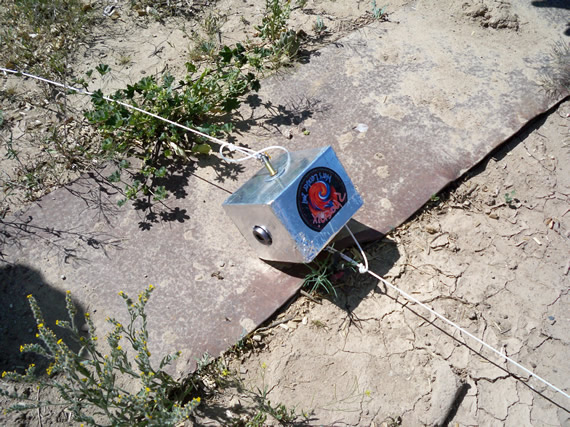
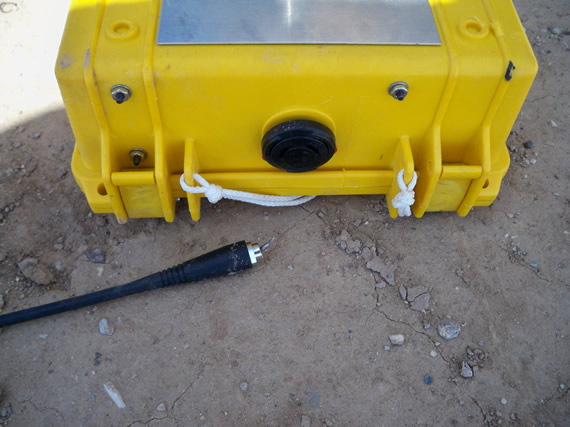
This is a secondary transmitter that was being tested. This one failed about 20 minutes into the flight but then started working again after the balloon popped. You can see the tracking data at <link>. This was designed by Mike Gray who was unfortunately killed by a drunk driver a little over a year ago.
The antenna broke off on landing. Easy fix.
Students getting the photo cards and data loggers out of their boxes to hand over to the group organizers. If they post any of these photos I will update the top of this blog posting.
Cleanup the landing zone. Look at all those cars that were in the chase caravan!
Look in the background! See how close our landing zone was from those power lines! Those lines power some large circular irrigation sprayers. If our 200 feet of line got tangled in those power lines our landing zone would have been easier to find. Just follow the fire trucks and SRP repair trucks. Ha. I think I would have skipped the landing party if that had happened. I sure hope our balloon doesn’t meet such a demise.
<<Below is just extra radio tracking details and techniques for the record>>
———————————————————————————————–
The prediction as of 4/9/2010 was plotted on GPSVisualizer.com:
The ANSR prediction plot using GPSVisualizer.com is available here for a few days only:
http://straighthome.hopto.org/ansr55-040910.html
General Communications Plan that ANSR follows:
The ANSR flights don’t broadcast on APRS 144.390 MHz, they
actually use a UHF freq which is on the their website at ANSR.org.
Then a chase unit digi-beats the APRS data
directly from the balloon onto APRS 144.390 MHz.
This is done for a couple of reasons,
1) Once the balloon gets up to altitude
it has the ability to hit literally
hundreds of digi-peaters and this causes some packet collisions.
2) Once the balloon is on the ground, it’s far easier to try
and DF (directional find) the single signal on the UHF freq, than trying to pick it out
from the 100’s of other signals on 144.390 MHz.
A mobile cross band digi-peater in a chase vehicle will repeat the 445.950 MHz APRS data to the 144.390 MHz national standard APRS frequency and subsequently it gets I-Gated to the Internet for out-of-area trackers.
Payload frequency plan:
Cross Band NB-FM Voice Repeater
Input: 145.560 MHz/162.2 Hz CTCSS tone
Output: 445.525 MHz Linked to IRLP Node 9255
Cross Band NB-FM Voice Repeater:
Details: http://www.ansr.org/kd7lmo/www.kd7lmo.net/pc.html
Input: 145.560 MHz/162.2 Hz CTCSS tone
Output: 445.525 MHz Linked to IRLP Node 9255
APRS when repeater not in use on 445.950 MHz at 10, 20, 40, and 50 seconds UTC time via KA7NSR-11
Landing prediction after burst at 15 and 45 seconds UTC time via KA7NSR (no -SSID) on APRS
Internet tracking via I-Gate
For general use: Track KA7NSR-11 on aprs.fi
More compact; For older browsers and mobile users: Track KA7NSR-11 on aprs.fi
Another general use tracking site: Track KA7NSR-11 on findu.com
APRS Beacon (KA7NSR-11):
445.950 MHz packet at 5, 25, 35, 55 seconds UTC time via KA7NSR-11
Internet tracking via I-Gate
For general use: Track KA7NSR-11 on aprs.fi
More compact; For older browsers and mobile users: Track KA7NSR-11 on aprs.fi
Another general use tracking site: Track KA7NSR-11 on findu.com
HF-Beacon:
Details including message format: http://www.ansr.org/kd7lmo/www.kd7lmo.net/hf-aprs.html
PSK-31 on 14070.450 KHz(20m) at 0, 6, 12, 18, 24, 30, 36, 42, 48,54 MINUTES and 00 seconds UTC time
No 80m PSK-31
APRS on 144.340MHz every minute at 54, 56, and 58 seconds UTC time via KA7NSR-11
APRS on 144.390MHz once a minute at 52 seconds UTC time via KA7NSR-11
Internet tracking via I-Gate
For general use: Track KA7NSR-11 on aprs.fi
More compact; For older browsers and mobile users: Track KA7NSR-11 on aprs.fi
Another general use tracking site: Track KA7NSR-11 on findu.com
Talk-in frequency used prior to launch and tracking team coordination
during flight (when the ANSR cross-band repeater is not available) is
the Sacaton Peak repeater, 447.725/442.725 MHz 100.0 Hz CTCSS tone.
Traffic on the cross-band input can inhibit the beacon activity from
the payload computer, therefore it is recommended an alternate simplex
frequency be used in the critical minutes during payload landing and recovery.
In order to decode the UHF data stream from the radio and get it to come up
on your computer, you are going to need a TNC.
A TNC is basically like a modem between a radio and the computer.
It talks to a serial port (DB-9), so you’ll
either need an older computer, or a USB-Serial Adaptor.
There is also a way to do this without a TNC
using the microphone jack on the computer.
For this option You’ll need a line-level to mic-level audio converter in line,
along with a 1:1 audio isolation transformer (about $3 at RadShack)
and then some drivers.
Then comes software, you’ll need
mapping and driver programs like UI-view, UI-point or
APRS point.
if you’ve got a mobile internet connection
and being the chase vehicle is repeating the data stream
over to 144.390 MHz you could of course always
track it on http://APRS.fi Using callsign KA7NSR-11.
Live APRS tracking relay webstie:
Callsign used on the balloon’s was KA7NSR-11
http://aprs.fi/
http://aprs.fi/?call=KA7NSR-11&mt=m&z=11&timerange=3600
http://aprs.fi/?call=KA7NSR-11&mt=m&z=11&timerange=43200

Links for Beginners in Electronics }:-)
Archives
- April 2017 (1)
- March 2017 (3)
- December 2016 (1)
- November 2016 (3)
- October 2016 (2)
- September 2016 (2)
- August 2016 (4)
- June 2016 (1)
- May 2016 (6)
- April 2016 (1)
- March 2016 (3)
- February 2016 (4)
- January 2016 (3)
- December 2015 (1)
- November 2015 (5)
- September 2015 (1)
- July 2015 (2)
- June 2015 (6)
- March 2015 (1)
- January 2015 (2)
- December 2014 (2)
- November 2014 (4)
- October 2014 (2)
- May 2014 (1)
- March 2014 (5)
- February 2014 (3)
- January 2014 (1)
- September 2013 (2)
- August 2013 (1)
- July 2013 (4)
- June 2013 (3)
- May 2013 (2)
- April 2013 (1)
- March 2013 (3)
- February 2013 (2)
- January 2013 (2)
- December 2012 (1)
- November 2012 (8)
- October 2012 (5)
- September 2012 (1)
- August 2012 (1)
- July 2012 (2)
- May 2012 (2)
- April 2012 (1)
- March 2012 (3)
- February 2012 (2)
- December 2011 (2)
- November 2011 (4)
- October 2011 (1)
- September 2011 (1)
- August 2011 (2)
- May 2011 (2)
- April 2011 (2)
- March 2011 (2)
- February 2011 (2)
- January 2011 (1)
- December 2010 (2)
- November 2010 (2)
- July 2010 (3)
- June 2010 (2)
- April 2010 (1)
- March 2010 (1)
- February 2010 (2)
- January 2010 (1)
- December 2009 (2)
- October 2009 (4)
- March 2009 (1)
- December 2008 (1)
- November 2008 (1)
- August 2008 (1)
- April 2008 (1)
- March 2008 (1)
- February 2008 (1)
- June 2007 (1)
- November 2005 (1)
- April 2005 (1)